
Introduction
Hillshades add depth and beauty to your maps and visualizations, but the typical results achieved with GIS alone aren’t always very effective.
Recent developments in QGIS have given it a suite of tools and functions that allow you to make much more visually appealing hillshades. This means you can get impressive results without exporting to specialist 3D software like Blender.
With QGIS enabling you to do so much, all you need now is a global dataset to work with. This is where the MapTiler Plugin comes in handy as it provides a global RGB Terrain dataset at ~30m resolution that you can access from the internet. Even though the data is streamed into QGIS, you can still use it like a regular raster DEM on your computer.
Exporting small areas of the Terrain RGB data opens up the possibility of using further processing and plugin tools, such as the brilliant Relief Visualization Toolbox.
To be able to work through this tutorial, you will need the following:
Before we start
- QGIS 3.28.x (This is the current long-term version, the tutorial will work with any version from 3.26 onwards)
- An internet connection, the MapTiler data is streamed from the cloud
- The MapTiler plugin (Again, get the latest version from the plugin manager)
- A (free) account with MapTiler Cloud so that you can access the maps. You can set up your account at https://www.maptiler.com/cloud/ in just a few minutes.
We can now work through the following steps:
- Setup the plugin
- Bringing in DEM data from MapTiler
- Using the Native Hillshade Options
- Exporting a DEM
- Using the Relief Visualisation Toolbox Plugin
Step 1: Setting up the plugin
After starting QGIS we need to install the MapTiler Plugin.
- Go to the Plugins menu and select Manage and Install Plugins…

- Type MapTiler in the search box and then click the Install Plugin button.

- Click Close to leave the plugin manager.
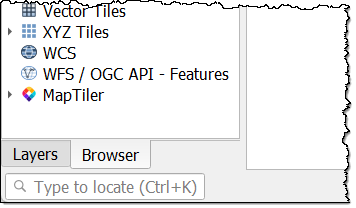
- Open the Browser tab on the right side of the screen. MapTiler should now appear in the list, as shown below.
Now we need to add your MapTiler Account details to the plugin. First, we will get a token from our MapTiler account page to verify who is using the plugin.
- In a web browser, log in to your MapTiler account or create a free one (if you don’t already have one) from here: https://cloud.maptiler.com/

- Open your MapTiler Cloud Account page from the menu on the left:
- Click on the Credentials tab
- Click on the New Credential button; you can name it MapTiler Plugin, so you know what you are using it for.

- Click on the token’s name, and on the next page, use the Copy token button to add it to your clipboard.
Note: keep this token private – treat it the same way as a password.
- Back in QGIS, Right-click on MapTiler in the browser panel and click on Account…

- Paste your Token into the space.
Your token will be saved into QGIS’s Authentication database. If you are having problems with this database, look at the guide on How to set up authentication for the MapTiler QGIS plugin.
You may see the following message if you haven’t used the secure password manager before:

Ensure your password is truly memorable, QGIS will retain it, but you will need to remember it if you reinstall QGIS or add another service.
You should now have a list of maps in the browser panel when you click the arrow next to MapTiler:

Double-click on a map title, and it will appear in the layers tab at the bottom of the list and draw in your map window. Note that it may be obscured by the layers above.
CONGRATULATIONS! You have now finished Step 1 and have access to all the data we need for the rest of the tutorial.
Step 2: Bringing DEM data in from MapTiler

Adding data using the plugin couldn’t be easier!
- Double-click on Terrain in the Browser panel; a group will appear in the map window and the layers panel with Terrain RGB and Ocean RGB.
- Repeat this step so the map has two Terrain groups. We will keep one for the colors and one to turn into a hillshade.
You should now have a map that looks like this:

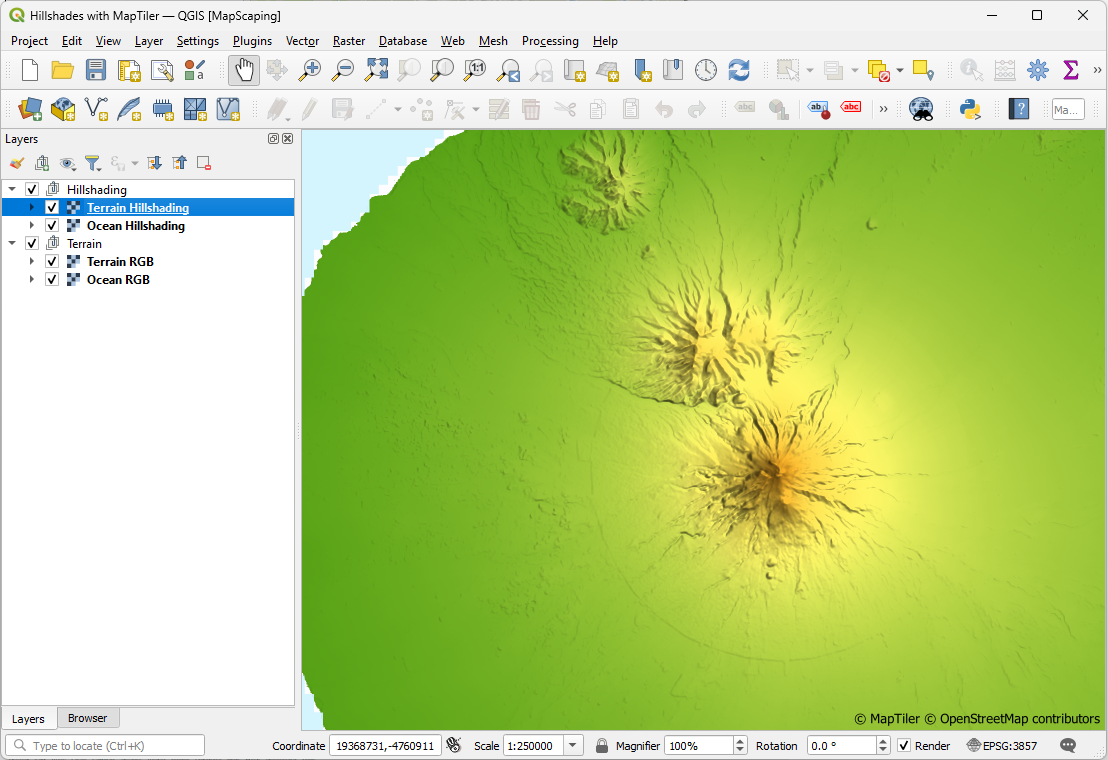
- Zoom in to around 1:250,000 in a mountainous area, such as Mt Taranaki in New Zealand

- Change the name of the first Terrain group to Hillshading.
- Rename the layers inside to Terrain Hillshading and Ocean Hillshading
- Save the project, and give it a name like Hillshades with MapTiler.

CONGRATULATIONS! You have now finished Step 2 and have the data we need to start creating a great-looking map with hillshading!
Step 3: Native Hillshade Options
We will now explore the options for creating hillshading using the standard styling settings. Recent enhancements have made QGIS excellent at doing what used to require specialist software like Blender.
Open the Layer Styling panel if it isn’t already using F7 or by clicking the paintbrush icon at the top of the layers panel.
Adjust the settings as per the following image:

- Make sure the layer is set to Terrain Hillshading.
- Switch to the Hillshade renderer; this is done in real-time to the terrain layer rather than creating new data.
- Change the Z-Factor to 1.5. This amplifies the effect, making the shadows deeper and the highlights brighter. This step is essential where the topography isn’t very steep.
- Switch on Multidirectional. This step elevates your hillshade to something much better than the usual light and dark areas. It simulates the effect of light bouncing off surrounding hillsides and creates a more realistic hillshade.
- Change the Blending mode to Multiply; this makes the shadow areas darker for the layers below the hillshade.
NOTE: Blending is a much more effective method than making the layer semi-transparent, which gives a cloudy effect that obscures some detail.
- Increase the Brightness to 60. The hillshade can make the layer too dark, so you may need to increase the brightness to combat this.
- Increasing the brightness can cause some loss of detail, so increase the Contrast to 10 to bring this back.
NOTE: I found the values above through trial and error; you are very likely to need different ones for different datasets!
- Switch on Early resampling. This ensures the layer doesn’t become pixelated when you zoom in beyond its native resolution, 30 x 30 meters.
Your map should now look something like this:
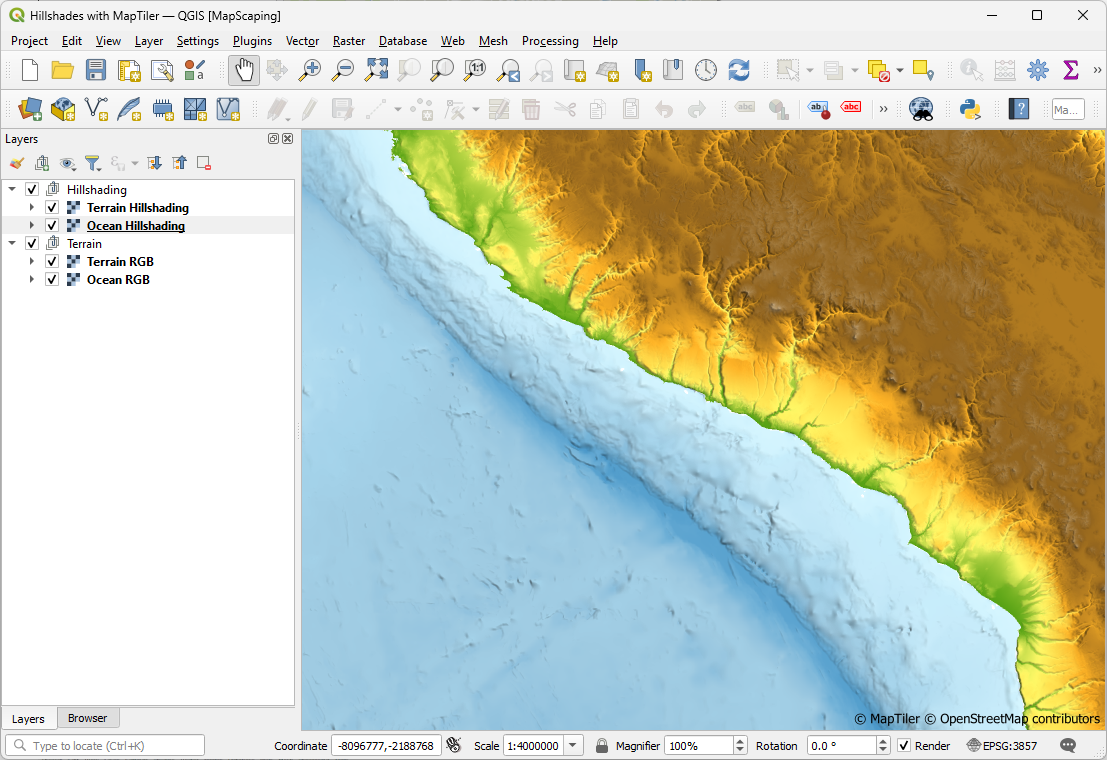
You can apply the same settings to the Ocean Hillshading layer by right-clicking on Terrain Hillshading on the Layers panel and selecting: Styles → Copy Style

You can then right-click on Ocean Hillshade in the Layers panel and select Styles → Paste Style.
You will now have Ocean hillshades as well as land for the whole planet!
SOMETHING EXTRA? Try some different Blending modes. What does Hard Light look like with the brightness -40 and contrast set to -15?
CONGRATULATIONS! You have now finished Step 3 and have learned how to use QGIS’s layer styling settings to create a great looking hillshade.
Step 4: Exporting a DEM
The hillshades above look great, but we can do more! However, we need to use plugins to really push the hillshading and for these to work, we must use data from a file, not streamed from the web.
Thankfully, you can use QGIS to Export small chunks of the Terrain RGB data from MapTiler to files.
In this step, we will export an area of the Terrain RGB data to make it usable in the plugin in Step 5. The plugins require the ability to read all the data to do the necessary calculations, which is impossible wit
- Zoom in to the area that you are interested, and keep it as tight as you can to avoid converting unnecessary data
NOTE: We will use a different area for the next part of the tutorial. This time we will use a seemingly flat location and generate a hillshade to pick out “hidden” topography.
- Copy and paste this Coordinate into the box below the map: -9885338,5367890
The location is Horicon Marsh, one of the largest drumlin fields in the world (See Wikipedia)
- Make sure the Scale is still set to 1:250,000
- Right-click on the Terrain RGB layer in the Layer panel and select Export → Save As…

We need to make a few changes in the window that opens to get the best output. See the image below and the instructions for what to change.
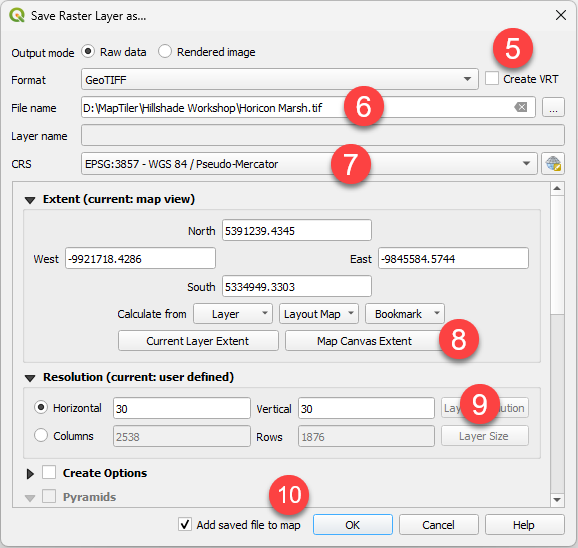
- Switch off the option to Create VRT, as you need a new file to work with.
- Give the file a location and name in the File name box.
- Ensure the CRS is set to the EPSG of your data, 3857 in this case.
- Click the Map Canvas Extent button to set the area to be the same as the map shown in QGIS.
- In the Resolution section, change the Horizontal and Vertical to be 30. This sets the pixel resolution, so the closer it matches the source (~30 meters), the better.
- Make sure the Add saved file to map is checked and click OK.
The new file will be added to the map and available for use in the plugins.

NOTE: Exporting layers from the MapTiler Plugin uses more of your credits than just viewing them. A multiplier is applied when data is extracted, as it can then be used multiple times without any further usage being recorded.
CONGRATULATIONS! You have now finished Step 4 and have created a new .tif file from the terrain RGB data ready to use with the Relief Visualization Toolbox.
Step 5: Using the Relief Visualisation Toolbox Plugin
Some plugins for creating hillshades in QGIS add additional functionality that isn’t available in the native options. The best one I have found is the Relief Visualization Toolbox from the University of Ljubljana. There is a guide to how it all works here:
- Install the plugin as we did before. No account is associated with this plugin, so you just need to search for it and click the install button.
- Open the Raster menu and select the newly added Relief Visualization Toolbox.

On the Visualisations tab, you can see all the different aspects of hillshade that RVT can create. It can get very complex, so we’ll use the Blender tab, where there are some great presets!
- At the top of the interface, select the tv6198_DSM_25CM.asc file as the input.
- Ensure the Add to QGIS and Save to raster location options are ticked, not the Overwrite option.
- Change to the Blender tab, as shown below:

- Choose Archaeological (VAT) designed to pick out detailed features in the landscape that are often difficult to pick out in regular hillshading.
- Tick the Use preset for terrain type option and change it to Flat. This increases the effect to boost the impact of small variations.
NOTE: Choosing the Steep option reduces the effect, so the image is not overwhelmed with deep dark shadows.
- Click the Blend images button at the bottom to start the processing.
It can take a while to run as it creates all the layers you can see in the window and then blends them together. The result is a stunning hillshade that picks out every last detail in the data. When the hillshade appears, we can improve its appearance using the Layer Style panel:
- Change the Blend mode to Multiply in the Layer Rendering section, so the colors come through the hillshade.
- In the Resampling section, change both the Zoomed in and Zoomed out to Bilinear so that the hillshade doesn’t look blocky when you change the zoom level.
Your map should look like this:

You should be able to see way more detail than with just the hillshading we created in the Layer styling panel!
SOMETHING EXTRA? Try again with the Save visualizations box ticked. This time the layers appear separately rather than all blended into one. Useful if you want more control over how the map looks. You can also try adjusting the presets. Use the information on the different layers here: https://rvt-py.readthedocs.io/en/latest/listofvis_main.html
Now try it with your own locations, it looks great on mountains, canyons, and volcanos!
CONGRATULATIONS! You have now finished Step 5 and the whole tutorial. I hope you have found it useful and can now create amazing maps with beautiful hillshading!
Author
Tom Armitage
Tom is an educator, writer, and speaker on all things GIS and Maps. He has over 20 years’ experience in the industry. Honing his skills at the University of Edinburgh and their Digimap service, he is now the Senior Technical Writer at MapTiler and an Honorary fellow of the School of Geosciences where he still teaches GIS Skills to postgraduate students.
Tom is also an OSGeo Charter Member, a committee member of OSGeoUK, and FOSS4G advocate. You can find him on Twitter and LinkedIn.
MapTiler
MapTiler is a Swiss company that innovates in the field of digital mapping by providing map API services for web developers.
Apart from terrain data used in this blog post, MapTiler provides maps for developers designed by their experienced cartographers, map tiling software for turning spatial data in to webmaps, and map server for self-hosting. With their software platform, clients produce maps that positively impact the lives of millions of people worldwide.
